Curious how your SAT® Test score compares? Knowing how your SAT® Test score compares to national and state averages can be a helpful tool as you study and prepare. What is the average SAT® Test score, both nationally and by state, and how does yours compare?
Average Score on the SAT® Test
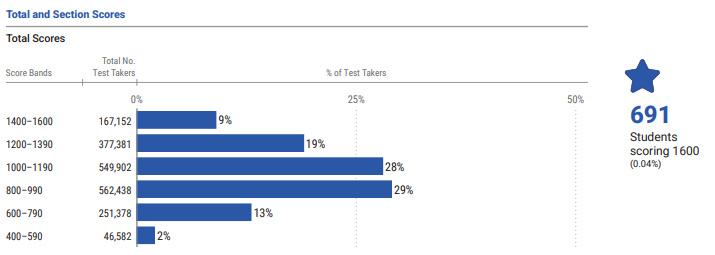
The latest national average (September 2026) on the SAT® Test is 1045, with a top score of 1600. By section, the national averages are:
Average Evidence-Based Reading and Writing score: 528
Average Math score: 517
This data can help you understand where your score ranks. If you score 1030, you’re in the 50th percentile: about half of the people taking the test scored higher than you and half scored lower.
Average Scores by State
This chart shows the latest data (September 2026) for average SAT® Test scores by state. Keep in mind the percentage of students who take the test in that state. If a state requires all its high school juniors to take the SAT® Test, overall scores might be lower. In other states, students may only take the SAT® Test if they plan to apply to college, or students in a particular state may primarily take the ACT® Test instead.
The most accurate comparisons are between states that have similar percentages of students taking the SAT® Test each year.
| % Taking the SAT® | Average Score by State | |
| Alabama | 3% | 1175 |
| Alaska | 27% | 1093 |
| Arizona | 10% | 1186 |
| Arkansas | 3% | 1187 |
| California | 30% | 1108 |
| Colorado | 92% | 994 |
| Connecticut | 94% | 992 |
| Delaware | 98% | 929 |
| District of Columbia | 82% | 957 |
| Florida | 86% | 983 |
| Georgia | 60% | 1041 |
| Hawaii | 31% | 1132 |
| Idaho | 67% | 1010 |
| Illinois | 15% | 1215 |
| Indiana | 100% | 952 |
| Iowa | 2% | 1227 |
| Kansas | 2% | 1236 |
| Kentucky | 4% | 1147 |
| Louisiana | 3% | 1198 |
| Maine | 39% | 1087 |
| Maryland | 74% | 1012 |
| Massachussetts | 57% | 1128 |
| Michigan | 100% | 959 |
| Minnesota | 4% | 1231 |
| Mississippi | 2% | 1029 |
| Missouri | 4% | 1187 |
| Montana | 5% | 1213 |
| Nebraska | 2% | 1270 |
| Nevada | 7% | 1189 |
| New Hampshire | 83% | 1025 |
| New Jersey | 68% | 1069 |
| New Mexico | 100% | 876 |
| New York | 63% | 1053 |
| North Carolina | 23% | 1177 |
| North Dakota | 1% | 1211 |
| Ohio | 22% | 1034 |
| Oklahoma | 3% | 1183 |
| Oregon | 26% | 1136 |
| Pennsylvania | 46% | 1092 |
| Rhode Island | 100% | 946 |
| South Carolina | 54% | 1021 |
| South Dakota | 2% | 1208 |
| Tennessee | 5% | 1189 |
| Texas | 75% | 972 |
| Utah | 2% | 1242 |
| Vermont | 50% | 1107 |
| Virginia | 50% | 1113 |
| Washington | 37% | 1103 |
| West Virginia | 98% | 918 |
| Wisconsin | 2% | 1244 |
| Wyoming | 2% | 1239 |
Does the average SAT® Test score matter?
The average SAT® Test score can be a good benchmark, but it shouldn’t be your goal. Here are a few other ways to know where your SAT® Test score stands.
Start by looking at the colleges you want to attend. If the admissions requirement at your top school is 1300, then you don’t want to settle for an average SAT® Test score of 1050. Even then, that can only be your final goal if you are looking to pay full price for college. Use the OnToCollege ACT® / SAT® Score Converter to help see where you stand.
Set a realistic but ambitious goal. For some students, the goal might be the state or national average SAT® Test score. For others, it might be higher. If your SAT® Test score is too low to receive any merit-based aid at your dream school, add a few more schools to your list!
Remember that you are your own biggest competition. Your goal should be to work your hardest to get your best score. That means preparing well, taking practice tests, and taking the SAT® multiple times. Don't compare yourself to your classmates or siblings.
Keep taking the test. Your first test will probably not be your best score. Many students earn their best score the third or fourth time they take the SAT® Test. So don’t stop with your first (or even second) score! Keep working hard and pushing yourself to see how you can improve.
________________________________________________________________________
Whether you’re looking to improve your below-average score to above-average or to get into your best-fit college (and win those scholarship dollars!), OTC Prep for the SAT® Test can help. Learn more on our website.